
Meraki Black Belt CTF Stage 3
I opened the Meraki Black Belt Stage 3 CTF thinking it’d be a quick refresher. Thirteen flags in, I realized it was testing something else entirely — not whether I knew the tools, but whether I’d reach for the right one under pressure. Every scenario reads like a real ticket. Vague symptom, a few things already ruled out, and one specific dashboard tool buried somewhere in Meraki’s sprawling toolset.
That’s the actual skill this CTF is checking for. Anyone can memorize where “Firmware Upgrades” lives. Knowing that a single user’s connectivity complaint means Current Client Connection, not WAN Health, only comes from having chased enough of these tickets yourself.
If you wanna play CTF, here are the links.
First, register yourself on the Cisco Partner Portal. Then, open the Cisco dCloud link to register for the CTF, or simply download the document below for step-by-step instructions.
Black Belt Support Meraki Stage 3 – Capture the Flag (CTF)
Here’s the full breakdown, flag by flag.
Flag 1
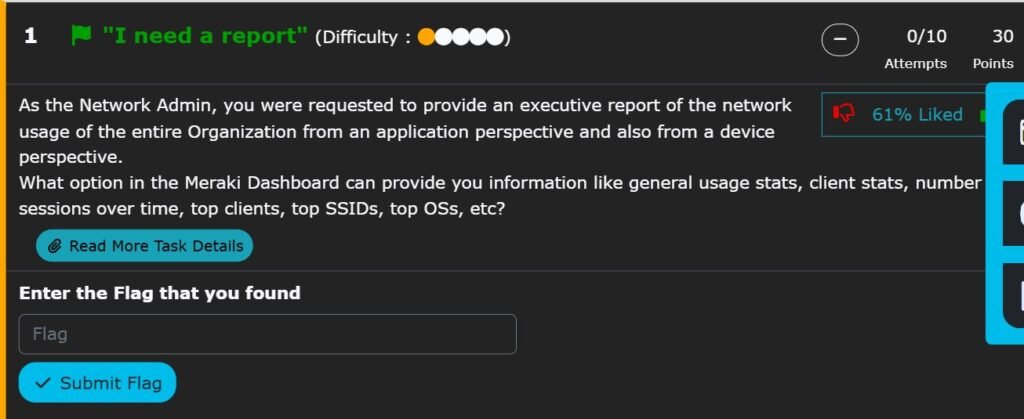
Question: As the Network Admin, you’re asked for an executive report of network usage across the entire organization — from both an application and a device perspective. What dashboard option gives you general usage stats, client stats, session counts, top clients, top SSIDs, and top OSs?
Answer: Summary Report, under Organization. You don’t build this from raw logs — Summary Report pulls all of it into one leadership-friendly view. It’s the tool you reach for when someone above you needs numbers, not packets.
Flag 2
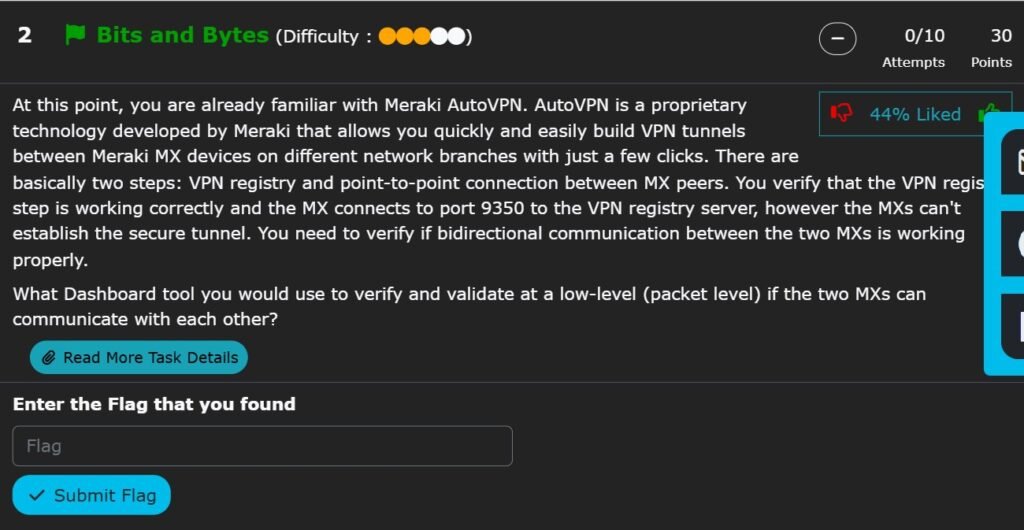
Question: AutoVPN’s registry step is confirmed working — both MXs connect to the registry server on port 9350 — but the secure tunnel between them won’t establish. What dashboard tool lets you verify and validate at a low level (packet level) whether the two MXs can communicate?
Answer: Packet Capture on the MX interface. Past this point, dashboard status pages won’t tell you anything new — you need to see if the two peers are actually exchanging traffic. It’s the only tool here that shows raw packets instead of a summarized status.
Flag 3
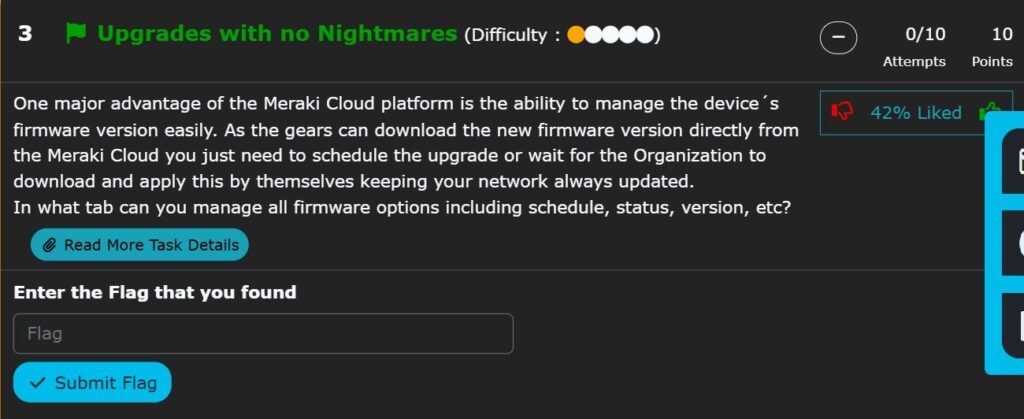
Question: Meraki devices can download new firmware directly from the cloud, letting you schedule upgrades or let the organization apply them automatically. What tab lets you manage all firmware options — schedule, status, version, and more?
Answer: Firmware Upgrades, under Organization. Worth a field note here: don’t let Meraki apply org-wide upgrade windows by default. Stagger them site by site, especially anywhere you can’t afford an unplanned reboot mid-day.
Flag 4
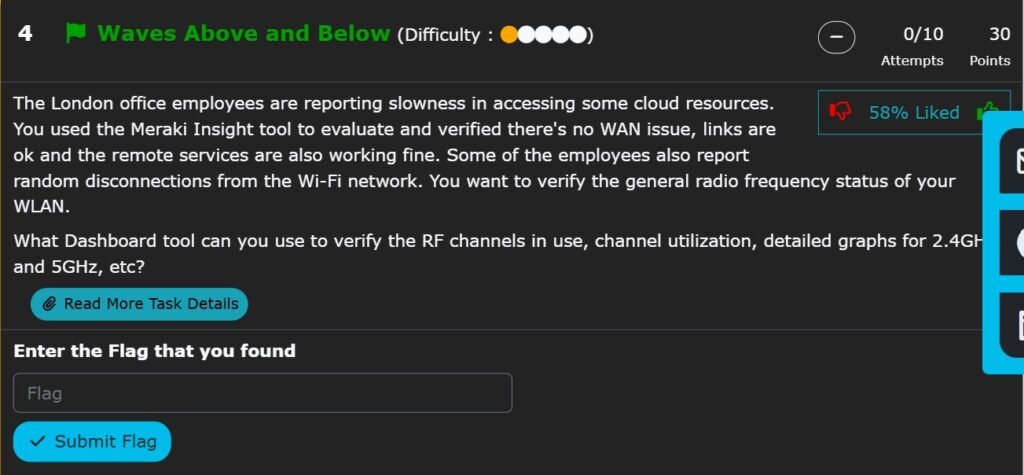
Question: London employees report slowness accessing cloud resources. You’ve confirmed there’s no WAN issue and remote services are fine. Some employees also report random Wi-Fi disconnections. What dashboard tool shows RF channels in use, channel utilization, and detailed graphs for 2.4GHz and 5GHz?
Answer: RF Spectrum. Before chasing anything client-side, check the physical layer first. This is where you catch a rogue microwave, a neighboring AP stepping on your channels, or plain RF noise — before wasting time on auth logs for a problem sitting at Layer 1.
Flag 5
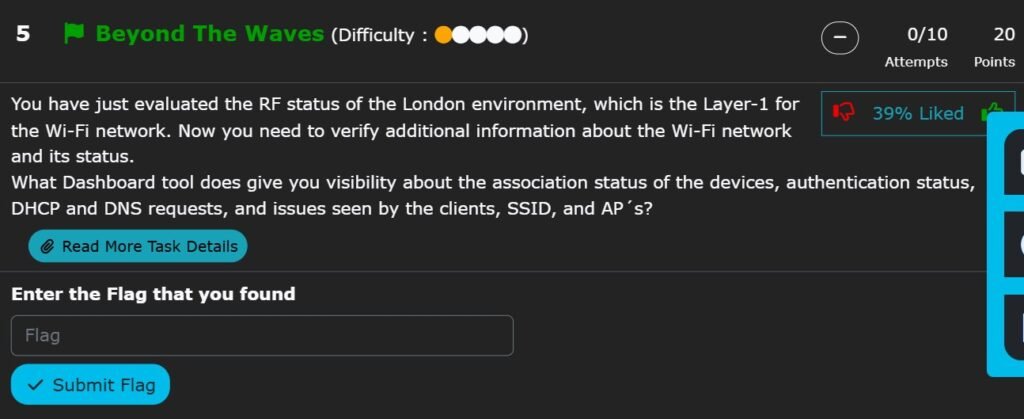
Question: You’ve just evaluated the RF status for London — Layer 1 for the Wi-Fi network. Now you need visibility into association status, authentication status, DHCP and DNS requests, and issues seen by clients, SSIDs, and APs. What dashboard tool gives you this?
Answer: Health (Wireless Health). It’s the natural next step after RF Spectrum — same investigation, one layer up the stack.
Flag 6
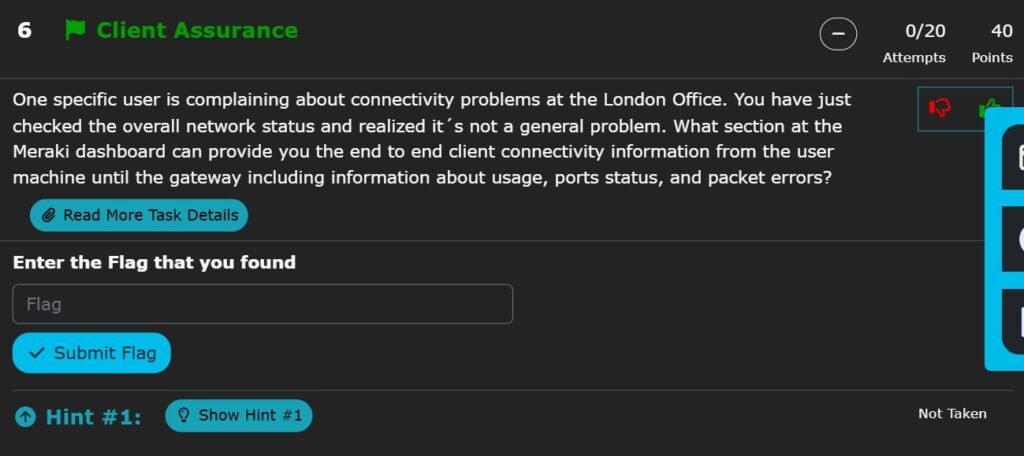
Question: One specific user at the London office is complaining about connectivity problems. You’ve checked overall network status and it’s not a general issue. What section gives you end-to-end client connectivity information — from the user’s machine to the gateway — including usage, port status, and packet errors?
Answer: Current Client Connection. When it’s one machine, not the network, go straight to that client’s own page. Don’t start at the network level for a single-user complaint.
Flag 7
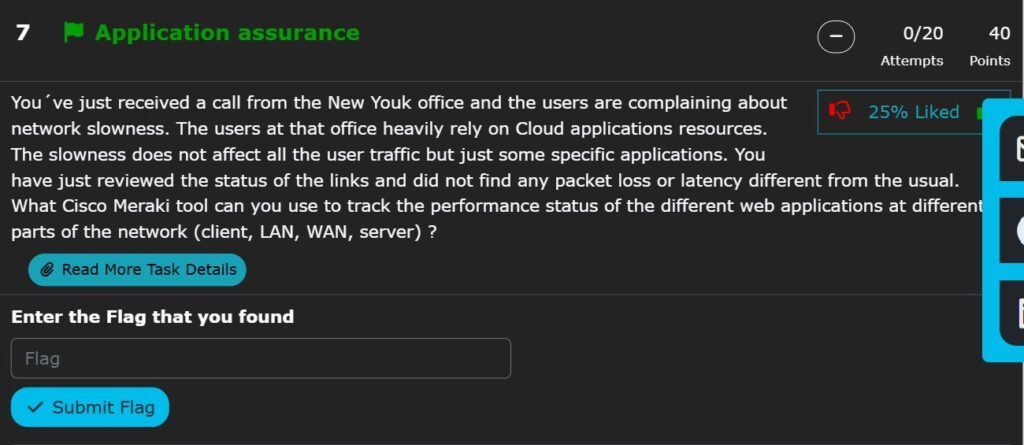
Question: New York users report network slowness, heavily affecting cloud application access. It’s not all traffic — just specific applications. Link status shows no unusual packet loss or latency. What Cisco Meraki tool tracks performance of specific web applications across client, LAN, WAN, and server segments?
Answer: Web App Health. Links being clean rules out a transport-layer problem — this is application-layer, and Web App Health lets you isolate whether it’s the app itself or the path to it.
Flag 8
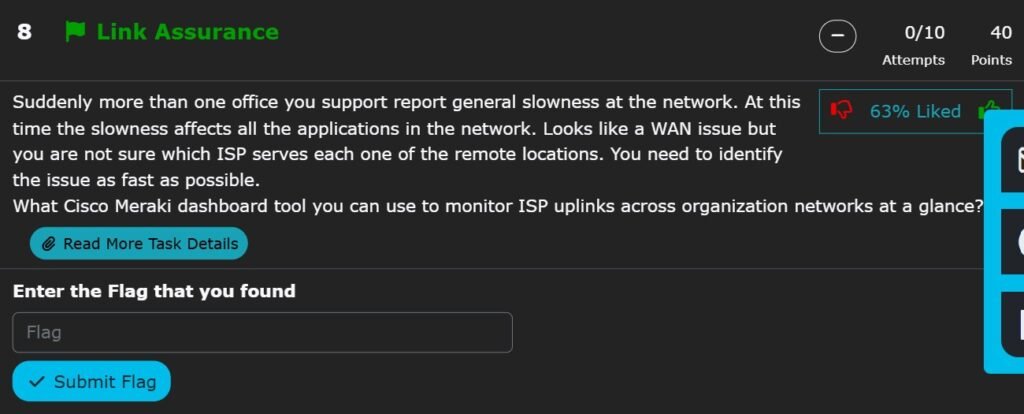
Question: More than one office reports general slowness, affecting all applications this time. It looks like a WAN issue, but you’re not sure which ISP serves each remote location. What Cisco Meraki dashboard tool monitors ISP uplinks across organization networks at a glance?
Answer: WAN Health. Multiple sites affected, all traffic affected — that’s the signature of a WAN issue. WAN Health gives you an org-wide view so you can spot the problem site fast without opening each network individually.
Flag 9
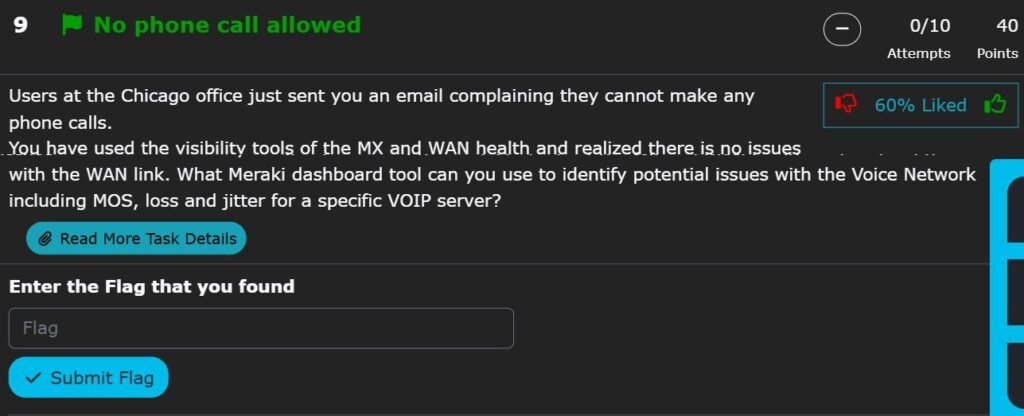
Question: Chicago office users report they cannot make any phone calls. You’ve checked MX and WAN health visibility tools and found no issues with the WAN link. What Meraki dashboard tool can identify potential issues with the voice network, including MOS, loss, and jitter for a specific VoIP server?
Answer: VoIP Health. WAN checks being clean doesn’t rule out a voice-specific problem — call quality issues need a tool built for voice. VoIP Health breaks down MOS, jitter, and loss per VoIP server, exactly the granularity this scenario needs.
Flag 10
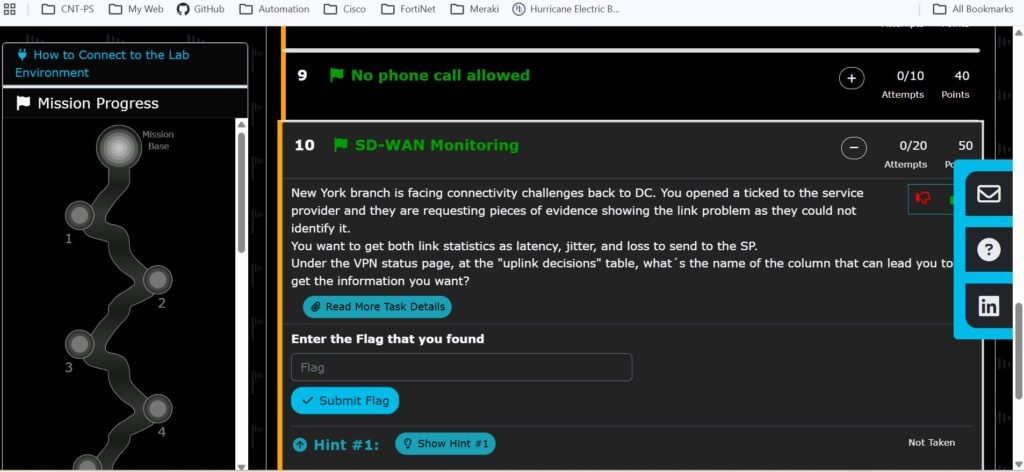
Question: New York branch is facing connectivity challenges back to DC. You’ve opened a ticket with the service provider, and they’re requesting evidence of the link problem since they couldn’t identify it themselves. You want both link statistics — latency, jitter, and loss. Under the VPN status page, at the “Uplink Decisions” table, what’s the name of the column that leads you to this information?
Answer: Uplink Decision. This column shows the same latency, jitter, and loss data Meraki’s SD-WAN engine uses to make routing decisions — which doubles as exactly the evidence packet you hand to a provider who’s pushing back on your claim.
Flag 11
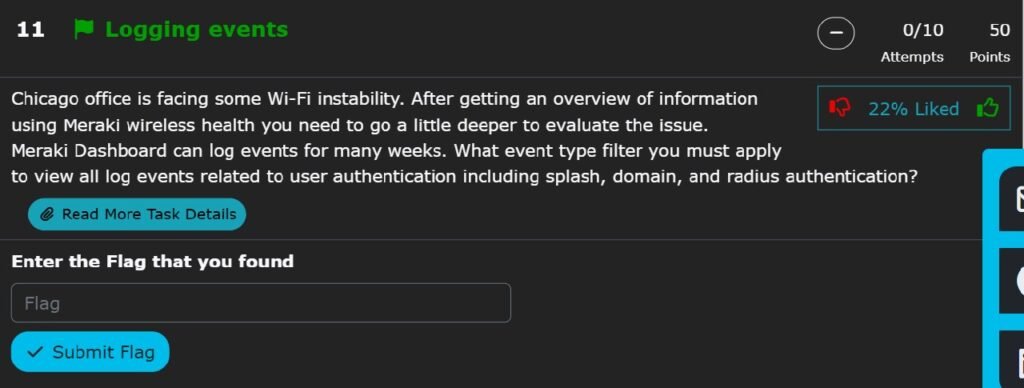
Question: Chicago office is facing some Wi-Fi instability. After getting an overview using Meraki Wireless Health, you need to go deeper. Meraki Dashboard can log events for many weeks. What event type filter must you apply to view all log events related to user authentication, including splash, domain, and RADIUS authentication?
Answer: All Auth. You’ve already done the Wireless Health pass — now you need history, not a live snapshot. Filtering the event log by All Auth pulls splash, domain, and RADIUS authentication events together, useful when the instability pattern only shows up over days.
Flag 12
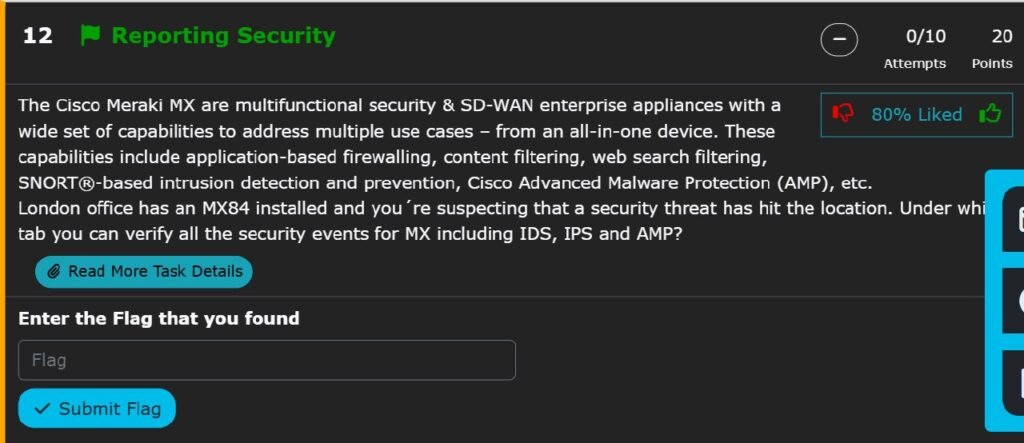
Question: The Cisco Meraki MX are multifunctional security and SD-WAN appliances with capabilities including application-based firewalling, content filtering, web search filtering, SNORT-based intrusion detection and prevention, and Cisco Advanced Malware Protection (AMP). London office has an MX84 installed and you suspect a security threat has hit the location. Under which tab can you verify all the security events for the MX, including IDS, IPS, and AMP?
Answer: Security Center. Rather than digging through IDS, IPS, and AMP logs one at a time, Security Center consolidates every MX security event into a single tab — the first place to look when you suspect something hit the appliance and need the full picture fast.
Flag 13
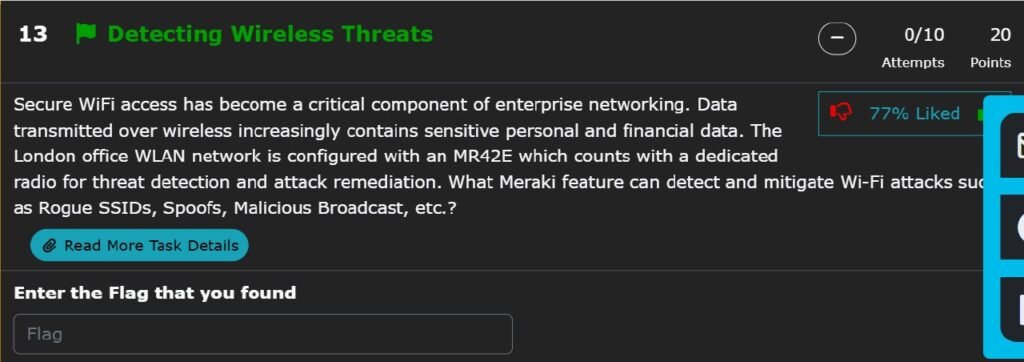
Question: Secure Wi-Fi access has become a critical component of enterprise networking, especially as sensitive personal and financial data increasingly travels over wireless. The London office WLAN is configured with an MR42E, which has a dedicated radio for threat detection and attack remediation. What Meraki feature can detect and mitigate Wi-Fi attacks such as Rogue SSIDs, Spoofs, and Malicious Broadcasts?
Answer: Air Marshal. The MR42E’s dedicated scanning radio is what makes this work without degrading Wi-Fi performance — it continuously watches for rogue SSIDs, spoofing, and malicious broadcasts on its own hardware, then remediates without touching client traffic.
Quick Reference Table
| # | Scenario | Dashboard Tool |
| 1 | Executive usage report | Summary Report |
| 2 | AutoVPN tunnel packet-level check | Packet Capture |
| 3 | Firmware scheduling/status | Firmware Upgrades |
| 4 | RF channel/interference check | RF Spectrum |
| 5 | Wireless auth/DHCP/DNS visibility | Health |
| 6 | Single-user end-to-end path | Current Client Connection |
| 7 | App-specific slowness | Web App Health |
| 8 | Multi-site ISP triage | WAN Health |
| 9 | Voice quality issue | VoIP Health |
| 10 | SP evidence for SD-WAN path | Uplink Decision |
| 11 | Historical auth event logging | All Auth |
| 12 | MX-level security events | Security Center |
| 13 | Rogue AP/wireless attack detection | Air Marshal |
FAQ
Is the Meraki Black Belt CTF the same across all stages? No. Each stage builds on the last, moving from basic dashboard navigation toward deeper troubleshooting scenarios involving multiple overlapping tools.
Do I need lab access to complete this CTF? Most flags can be answered from dashboard familiarity alone, but hands-on lab time is what actually makes the muscle memory stick — reading about RF Spectrum and staring at a real interference graph are two different skills.
What’s the difference between WAN Health and Uplink Decision? WAN Health gives you an org-wide glance at uplink status across sites. Uplink Decision, inside VPN status, shows the specific latency, jitter, and loss data Meraki’s SD-WAN engine used to make routing decisions — more granular, and better as evidence for an ISP dispute.
Why does Air Marshal need a dedicated radio? Scanning for rogue SSIDs and spoofed broadcasts continuously would otherwise compete with client-serving radios for airtime. A dedicated scanning radio, like the one on the MR42E, lets threat detection run without degrading Wi-Fi performance.
Read Also : Learn Meraki Automation
🔧 Free Network Tools
Handy while you're troubleshooting — no signup needed.